Linux系统time命令基本使用方法与常见示例
时间:2026-08-21 | 作者:电竞小硕 | 阅读:0一、time命令介绍
二、time版本介绍
2.1 time版本简介
在 Unix 或类 Unix 系统中,time 命令通常有两个不同版本。
一个是 Shell 内置的 time,另一个是位于 /usr/bin/time 的 GNU time。 这两者存在一些关键区别。
Shell 内置的 time
位置:这个 time 是 shell 的一部分,不是独立的可执行文件。
选项:它支持较少的选项,通常只支持基本的时间测量功能。
输出:它的输出格式比较固定,一般只能显示 real, user, sys 时间。
GNU time
位置:这个 time 通常是 /usr/bin/time,是一个独立的可执行文件。
选项:它支持更多的选项,比如 -o(将输出重定向到文件)、-a(追加到文件)、-f(自定义输出格式)等。
2.2 检查 time 的类型
type -a time如果返回结果中出现以下内容,就说明系统中存在不同类型的 time:
time是一个 Shell 关键字,用于统计命令执行时间。time也可以指向/usr/bin/time,这代表 GNU 版本的 time 工具。
2.3 安装GNU time
dnf install time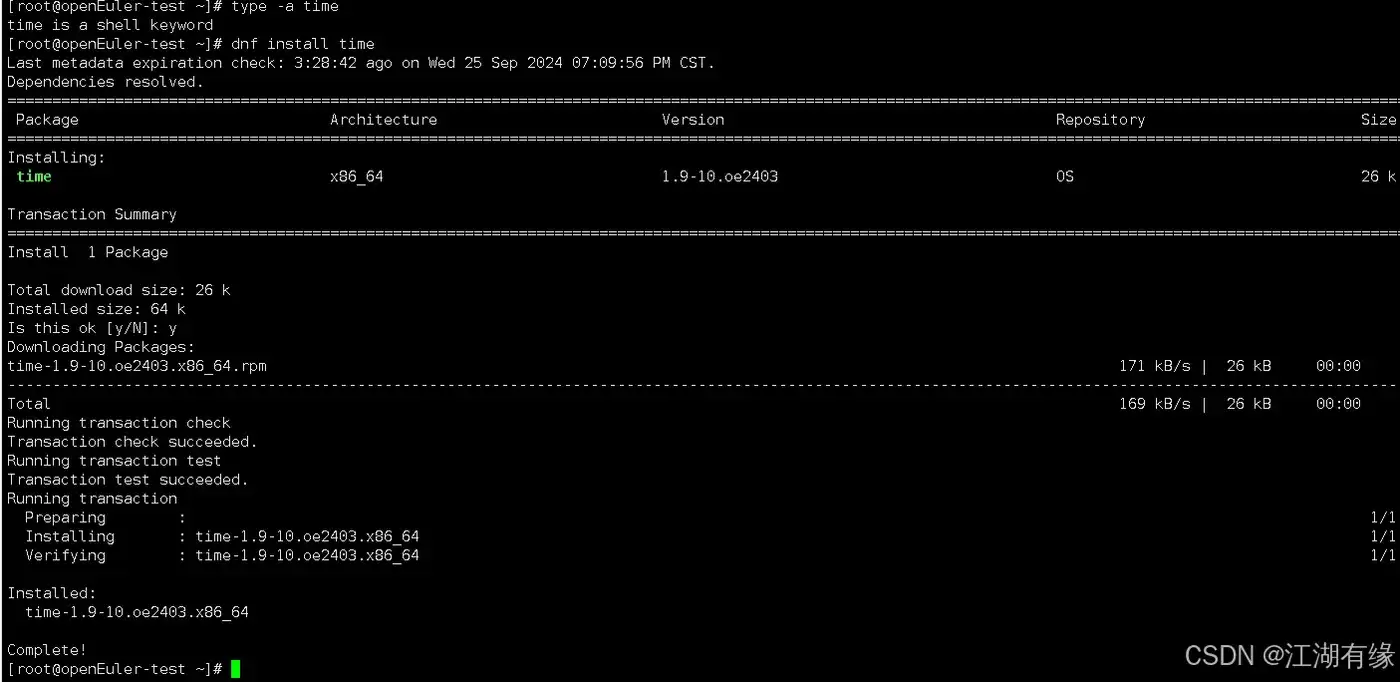
三、time命令的使用帮助
3.1 Shell内置time用法
基本语法
time [选项] 命令(指令:指定需要运行的额指令及其参数)3.2 GNU time用法
[root@openEuler-test ~]# /usr/bin/time --help
Usage: /usr/bin/time [OPTIONS] COMMAND [ARG]...
Run COMMAND, then print system resource usage.
-a, --append              with -o FILE, append instead of overwriting
-f, --format=FORMAT       use the specified FORMAT instead of the default
-o, --output=FILE         write to FILE instead of STDERR
-p, --portability         print POSIX standard 1003.2 conformant string:
                          real %%e
                          user %%U
                          sys %%S
-q, --quiet               do not print information about abnormal program
                          termination (non-zero exit codes or signals)
-v, --verbose             print all resource usage information instead of
                          the default format
-h, --help                display this help and exit
-V, --version             output version information and exit

Commonly usaged format sequences for -f/--format:
(see documentation for full list)
%%   a literal '%'
%C   command line and arguments
%c   involuntary context switches
%E   elapsed real time (wall clock) in [hour:]min:sec
%e   elapsed real time (wall clock) in seconds
%F   major page faults
%M   maximum resident set size in KB
%P   percent of CPU this job got
%R   minor page faults
%S   system (kernel) time in seconds
%U   user time in seconds
%w   voluntary context switches
%x   exit status of command
选项解释:
| 选项 | 描述 |
|---|---|
-a, --append | 与 -o FILE 一起使用时,追加到文件而不是覆盖。 |
-f, --format=FORMAT | 使用指定的 FORMAT 而不是默认格式。 |
-o, --output=FILE | 将输出写入指定的文件而不是标准错误(STDERR)。 |
-p, --portability | 打印符合 POSIX 标准 1003.2 的字符串: real %%e user %%U sys %%S |
-q, --quiet | 不打印关于异常程序终止的信息(非零退出码或信号)。 |
-v, --verbose | 打印所有资源使用信息,而不是默认格式。 |
-h, --help | 显示帮助信息并退出。 |
-V, --version | 输出版本信息并退出。 |
四、time命令的直接使用
[root@openEuler-test ~]# time hostname
openEuler-test

real    0m0.002s
user    0m0.000s
sys     0m0.001s
其中三项输出的含义如下:
real表示的是整个过程的实际经过时间。user表示的是用户空间中的代码执行所花费的 CPU 时间。sys表示的是内核空间中的代码执行所花费的 CPU 时间。
五、/usr/bin/time的基本使用
5.1 /usr/bin/time直接使用
[root@openEuler-test ~]# /usr/bin/time ls
aaaa.txt
anaconda-ks.cfg
birthday-cake.jpg
gift.jpg
k8s.png
output.png
qrcode.svg
wordpress-4.9.1-zh_CN.tar.gz
0.00user 0.00system 0:00.00elapsed 100%CPU (0avgtext 0avgdata 2424maxresident)k
0inputs 0outputs (0major 113minor)pagefaults 0swaps第一行:
显示的是 ls 命令的输出结果。
第二行
显示的是 /usr/bin/time 输出的时间和资源使用信息。
第三行
如果命令输出较多,时间统计信息通常会紧跟在命令输出之后显示。
5.2 打印标准输出
[root@openEuler-test ~]# /usr/bin/time -p ls
aaaa.txt
anaconda-ks.cfg
birthday-cake.jpg
gift.jpg
k8s.png
output.png
qrcode.svg
wordpress-4.9.1-zh_CN.tar.gz
real 0.00
user 0.00
sys 0.00
5.3 打印所有资源信息
[root@openEuler-test ~]# /usr/bin/time -v ls
aaaa.txt
anaconda-ks.cfg
birthday-cake.jpg
gift.jpg
k8s.png
output.png
qrcode.svg
wordpress-4.9.1-zh_CN.tar.gz
Command being timed: "ls"
User time (seconds): 0.00
System time (seconds): 0.00
Percent of CPU this job got: 0%
Elapsed (wall clock) time (h:mm:ss or m:ss): 0:00.00
Average shared text size (kbytes): 0
Average unshared data size (kbytes): 0
Average stack size (kbytes): 0
Average total size (kbytes): 0
Maximum resident set size (kbytes): 2456
Average resident set size (kbytes): 0
Major (requiring I/O) page faults: 0
Minor (reclaiming a frame) page faults: 113
Voluntary context switches: 1
Involuntary context switches: 0
Swaps: 0
File system inputs: 0
File system outputs: 0
Socket messages sent: 0
Socket messages received: 0
Signals delivered: 0
Page size (bytes): 4096
Exit status: 0| 字段 | 值 | 描述 |
|---|---|---|
| Command being timed | "ls" | 正在计时的命令是 ls。 |
| User time (seconds) | 0.00 | 用户空间中的代码执行所花费的 CPU 时间(秒)。 |
| System time (seconds) | 0.00 | 内核空间中的代码执行所花费的 CPU 时间(秒)。 |
| Percent of CPU this job got | 0% | 该任务获得的 CPU 百分比。 |
| Elapsed (wall clock) time | 0:00.00 | 实际经过的时间(墙钟时间),格式为 h:mm:ss 或 m:ss。 |
| Average shared text size (kbytes) | 0 | 平均共享文本段大小(KB)。 |
| Average unshared data size (kbytes) | 0 | 平均非共享数据段大小(KB)。 |
| Average stack size (kbytes) | 0 | 平均堆栈大小(KB)。 |
| Average total size (kbytes) | 0 | 平均总大小(KB)。 |
| Maximum resident set size (kbytes) | 2456 | 最大驻留内存大小(KB)。 |
| Average resident set size (kbytes) | 0 | 平均驻留内存大小(KB)。 |
| Major (requiring I/O) page faults | 0 | 需要 I/O 的主要页错误次数。 |
| Minor (reclaiming a frame) page faults | 113 | 重新分配帧的次要页错误次数。 |
| Voluntary context switches | 1 | 自愿上下文切换次数。 |
| Involuntary context switches | 0 | 非自愿上下文切换次数。 |
| Swaps | 0 | 交换操作次数。 |
| File system inputs | 0 | 文件系统输入次数。 |
| File system outputs | 0 | 文件系统输出次数。 |
| Socket messages sent | 0 | 发送的套接字消息数。 |
| Socket messages received | 0 | 接收的套接字消息数。 |
| Signals delivered | 0 | 传递的信号数。 |
| Page size (bytes) | 4096 | 页面大小(字节)。 |
| Exit status | 0 | 命令的退出状态码。 |
5.4 将执行时间写入到文件中
[root@openEuler-test ~]# /usr/bin/time -o aa.txt ping www.baidu.com -c 4
PING www.a.shifen.com (153.3.238.102) 56(84) bytes of data.
64 bytes from 153.3.238.102 (153.3.238.102): icmp_seq=1 ttl=53 time=14.8 ms
64 bytes from 153.3.238.102 (153.3.238.102): icmp_seq=2 ttl=53 time=14.2 ms
64 bytes from 153.3.238.102 (153.3.238.102): icmp_seq=3 ttl=53 time=14.3 ms
64 bytes from 153.3.238.102 (153.3.238.102): icmp_seq=4 ttl=53 time=15.0 ms

--- www.a.shifen.com ping statistics ---
4 packets transmitted, 4 received, 0% packet loss, time 3002ms
rtt min/avg/max/mdev = 14.212/14.590/14.991/0.320 ms
查看该文件内容:
[root@openEuler-test ~]# cat aa.txt
0.00user 0.00system 0:03.05elapsed 0%CPU (0avgtext 0avgdata 2920maxresident)k
0inputs 0outputs (0major 144minor)pagefaults 0swaps
5.5 追加信息
[root@openEuler-test ~]# /usr/bin/time -a -o aa.txt ls
aaaa.txt
anaconda-ks.cfg
birthday-cake.jpg
gift.jpg
k8s.png
output.png
qrcode.svg
wordpress-4.9.1-zh_CN.tar.gz

[root@openEuler-test ~]# cat aa.txt
0.00user 0.00system 0:03.05elapsed 0%CPU (0avgtext 0avgdata 2920maxresident)k
0inputs 0outputs (0major 144minor)pagefaults 0swaps
0.00user 0.00system 0:00.00elapsed 0%CPU (0avgtext 0avgdata 2472maxresident)k
0inputs 0outputs (0major 115minor)pagefaults 0swaps
5.6 格式化时间输出
/usr/bin/time -f "time: %U" ls
| 参数 | 描述 |
|---|---|
%E | 实际经过时间(real time),显示格式为 [小时:]分钟:秒。 |
%U | 用户空间中的代码执行所花费的 CPU 时间(user time)。 |
%S | 内核空间中的代码执行所花费的 CPU 时间(system time)。 |
%C | 进行计时的命令名称及其命令行参数。 |
%D | 进程非共享数据区域的大小,以 KB 为单位。 |
%x | 命令退出状态码。 |
%k | 进程接收到的信号数量。 |
%w | 进程被交换出主存的次数。 |
%Z | 系统的页面大小(page size),这是一个系统常量,不同系统中该值可能不同。 |
%P | 进程所获取的 CPU 时间百分比,这个值等于 (user system) 时间 / 总运行时间。 |
%K | 进程的平均总内存使用量(包括 data stack text),单位是 KB。 |
%W | 进程主动进行上下文切换的次数,例如等待 I/O 操作完成。 |
%c | 进程被迫进行上下文切换的次数(由于时间片到期)。 |
六、注意事项
使用前需要先区分 Shell 内置 time 和 GNU time。 如果要使用更多高级选项,应确保调用的是 /usr/bin/time。
- 使用
-o选项重定向输出:可将time的输出写入文件中,便于后续分析。 - 自定义输出格式:可使用
-f选项,以便获取更详细的资源使用信息。 - 启用详细模式:可使用
-v选项,查看所有资源使用信息。 - 处理异常终止:可使用
-q选项,抑制关于异常程序终止的信息,如非零退出码或信号。 - 检查系统路径:确保
/usr/bin/time在你的PATH环境变量中,或者直接使用完整路径调用。 - 注意时间精度:对于非常短的命令,
time可能无法提供高精度的时间测量,因为系统计时器有最小分辨率。 - 理解百分比 CPU 使用率:CPU 使用率基于
(user system) / elapsed计算,对于极短的命令可能会显示为 100%。 - 查看帮助和版本信息:可使用
-h或--help查看帮助信息,使用-V或--version查看版本信息。

免责声明:文中图文均来自网络,如有侵权请联系删除,心愿游戏发布此文仅为传递信息,不代表心愿游戏认同其观点或证实其描述。
相关文章
更多-

- 迅捷路由器怎么调信号最强,设置时要注意什么?
- 时间:2026-08-27
-

- vivo浏览器怎么卸不掉?原因和解决方法在这里
- 时间:2026-08-27
-

- OPPO R11s黑屏了,怎么强制恢复出厂设置?
- 时间:2026-08-27
-

- 飞利浦显示器包装盒有生产日期和保修期吗?怎么看?
- 时间:2026-08-27
-

- 联想新平板开机必须联网吗?怎么做?
- 时间:2026-08-27
-

- 平板横竖屏切换设置与问题解决
- 时间:2026-08-27
-

- 移动电源容量怎么测?要准备哪些工具?
- 时间:2026-08-27
-

- 荣耀90 Pro防水吗?防水级别多少?怎么用才安全
- 时间:2026-08-27
精选合集
更多大家都在玩
大家都在看
更多-

- 糖尿病完全不能吃糖吗
- 时间:2026-09-15
-
- 蚂蚁庄园小课堂2026年9月16日最新题目答案
- 时间:2026-09-15
-
- 小鸡答题今天的答案是什么2026年9月16日
- 时间:2026-09-15
-
- 蚂蚁庄园每日答题答案2026年9月16日
- 时间:2026-09-15
-
- 以下哪种粮食是酿造绍兴黄酒的主要原料 蚂蚁庄园今日答案9月16日
- 时间:2026-09-15
-
- 劝学名句“及时当勉励,岁月不待人”出自哪位诗人 蚂蚁庄园今日答案9.16
- 时间:2026-09-15
-
- 蚂蚁庄园今天答题答案2026年9月16日
- 时间:2026-09-15
-
- 蚂蚁庄园答题今日答案2026年9月16日
- 时间:2026-09-15